
How to Calculate Retirement Income: Your 2024 Guide

Your expected retirement income comes down to one core equation: what you’ve saved, how long it grows, and how long it needs to last. Start by adding your current savings balance to projected future contributions, apply a realistic annual growth rate, then divide the resulting nest egg by your expected years in retirement. A common planning baseline is to target at least 70% of your pre-retirement income as your annual retirement spending goal.
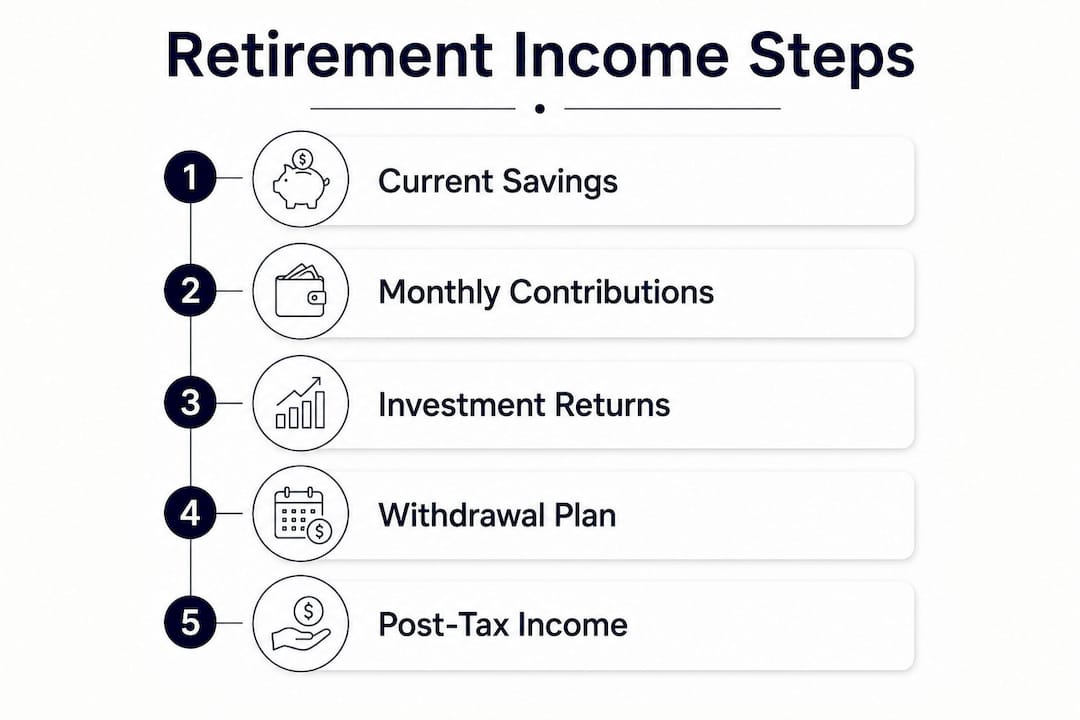
Here’s a quick-start breakdown of the key steps:
- Identify your current savings across all accounts: 401(k), IRA, brokerage, and any pension value.
- Estimate your monthly contributions and project them forward to your target retirement age.
- Apply a growth rate. Most calculators default to roughly 6% pre-retirement return, which is conservative relative to long-term stock market history.
- Factor in inflation, typically assumed at around 3% annually.
- Add Social Security and any pension income to your projected portfolio withdrawals.
- Divide your projected nest egg by your expected retirement years to get an annual draw, then check it against your spending target.
For example: if you’re 45, have $200,000 saved, contribute $500 a month, and retire at 67, a 6% return assumption produces a nest egg in the range of $900,000 or more. Whether that funds a 25-year retirement comfortably depends entirely on your spending needs and tax situation.
How retirement income calculators work and what you need to enter
Retirement calculators run compound growth math on your inputs and then model withdrawals against a projected lifespan. The accuracy of the output is only as good as the accuracy of what you put in.

| Input | Why it matters | Typical default |
|---|---|---|
| Current savings balance | Starting point for all projections | User-entered |
| Monthly contribution | Drives accumulation between now and retirement | User-entered |
| Current age / retirement age | Sets the compounding window | Retirement at 67 |
| Expected rate of return | Pre-retirement growth assumption | ~6% |
| Inflation rate | Erodes purchasing power over time | ~3% |
| Life expectancy | Determines how long income must last | Up to age 95 |
| Annual salary increase | Adjusts future contributions upward | ~2% |
| Social Security benefit | Added to portfolio withdrawals | SSA estimate |
Calculators like the AARP Retirement Calculator and the NerdWallet retirement calculator let you enter Social Security estimates, pension income, and expected spending levels alongside your savings data. The Ameriprise retirement monthly income calculator takes a similar approach, letting you model monthly income needs directly. The Vanguard retirement income calculator focuses on portfolio-based projections and allows you to toggle withdrawal rates and time horizons. All three tools use compounding and inflation-adjusted withdrawal math under the hood, but they differ in how much flexibility they give you to customize assumptions.
Planning for longevity to age 95 is now considered a conservative and prudent assumption, not an outlier. An annual salary increase of 2% is also worth including, since it affects how much you’ll realistically contribute in your peak earning years.
How to read your calculator results without fooling yourself
The three numbers most calculators surface are your projected nest egg at retirement, your estimated monthly income from that nest egg, and your income replacement percentage. That last figure is the one worth scrutinizing first.
- Compare your replacement rate to your actual spending. A 70% replacement rate sounds reasonable, but if your mortgage is paid off and your kids are grown, you may need less. If you plan to travel heavily, you may need more.
- Look at the after-tax number. Federal income tax applies to withdrawals from tax-deferred accounts like 401(k)s and IRAs, and most states tax distributions too. At a combined 30% tax rate, a $1,000 withdrawal nets $700. Your calculator’s gross projection and your actual spendable income are two different figures.
- Check the Social Security timing assumption. Collecting at full retirement age (around 67 for most people born after 1960) yields 100% of your calculated benefit. Early collection at 62 reduces that monthly amount by up to 30%.
- Watch for shortfall alerts. If the calculator flags a gap, the fix is usually one of three levers: save more now, retire later, or plan to spend less.
- Stress-test with a lower return. Run the same scenario at 4% instead of 6% and see how the output changes. The gap between those two projections tells you how much margin you actually have.
Post-tax projections are critical. Taxes can consume a meaningful portion of retirement income, and realistic post-tax planning is one of the most commonly skipped steps in DIY retirement math.

What retirement calculators assume and where they fall short
Every retirement calculator bakes in assumptions, and most of them are printed in fine type at the bottom of the results page. Knowing what those assumptions are keeps you from treating a projection as a guarantee.
Common built-in assumptions include:
- Inflation at 3% annually, though actual inflation can run higher for extended periods.
- Pre-retirement returns of ~6%, conservative versus the historic ~10% average for broad stock market indexes, but still optimistic in a low-return environment.
- Safe withdrawal rates of 3.5%–4% annually to sustain income across a 30-year retirement horizon.
- Life expectancy to age 95, which most people underestimate for themselves.
- Static tax rates, even though tax law changes regularly.
Where calculators consistently fall short: they rarely account for healthcare and long-term care costs, which can run into the hundreds of thousands of dollars over a retirement lifetime. They also tend to assume steady, uninterrupted contributions and ignore sequence-of-returns risk, meaning a market downturn in the first few years of retirement can permanently impair a portfolio even if long-term averages hold.
Treat every calculator result as a planning scenario, not a forecast. These tools are educational by design. The disclaimer language on the AARP Retirement Calculator and NerdWallet retirement calculator both make this explicit. Use the outputs to identify the direction of your plan, then refine with a licensed advisor.
Why you should revisit your retirement income projections every year
A retirement projection built in 2022 and never updated is almost certainly wrong by now. Markets moved, inflation spiked, tax brackets shifted, and your personal situation probably changed too. Annual reviews are what keep projections connected to reality.
Key areas to revisit each year:
- Contribution rate. Did you get a raise? Increase contributions to match.
- Rate of return assumption. Adjust if your portfolio allocation shifted.
- Inflation expectation. If actual inflation ran above 3%, update your model.
- Social Security estimate. The SSA updates your projected benefit annually at ssa.gov.
- Healthcare cost buffer. Add a dedicated line item if you haven’t already.
- Tax law changes. IRS contribution limits and bracket thresholds change most years.
Pro Tip: Run your projections using a 4% inflation assumption and a 4% return instead of the standard 6%/3% split. If the plan still works under those conditions, you have real margin. If it breaks, you’ve found the problem before it finds you.
Starting early compounds the benefit of every review. Starting to save earlier with consistent annual contributions results in substantially larger retirement savings than starting later, assuming a steady return rate under the same conditions, according to AARP’s analysis. The gap isn’t just about time. It’s about compounding working on a larger base for longer.
Progressiveplanner’s Dual Purpose Retirement Strategy™ addresses one of the biggest gaps in standard retirement math: the single-bucket problem. Traditional planning parks savings in one tax-deferred vehicle like a 401(k) or IRA. The Dual Purpose Retirement Strategy™ uses Indexed Universal Life policies alongside conventional accounts, so the same dollar generates two tax-advantaged income streams. That structure also provides downside protection, which matters most in the early years of retirement when sequence-of-returns risk is highest.
How pensions, Medicare, and other government benefits fit into your income plan
Social Security is the most familiar government benefit, but it’s rarely the only one. Pensions from federal, state, or municipal employment can provide a fixed monthly income that calculators often undercount or ignore entirely. If you have a defined benefit pension, get the exact projected monthly amount from your plan administrator and enter it as a guaranteed income source separate from your portfolio withdrawals.
Medicare reduces but doesn’t eliminate healthcare costs. Premiums for Medicare Part B and Part D, plus out-of-pocket costs for dental, vision, and long-term care, still require dedicated budget line items. Federal employee retirees may also have access to FEHB coverage, which changes the math further.
Veterans’ benefits, survivor benefits, and state-level programs for low-income retirees are additional sources that rarely appear in standard calculator inputs. If any of these apply to you, add them as fixed monthly income before calculating how much your portfolio needs to generate. Every dollar of guaranteed income from a pension or government program reduces the withdrawal burden on your savings, which directly extends how long your money lasts.
Key Takeaways
Accurately projecting retirement income requires combining savings growth, realistic assumptions, and multiple income sources reviewed annually.
| Point | Details |
|---|---|
| Start with the 70% baseline | Target at least 70% of pre-retirement income as your annual retirement spending goal. |
| Tax reduces gross withdrawals | At a 30% combined tax rate, a $1,000 withdrawal leaves $700 in spendable income. |
| Early saving compounds dramatically | Contributing early can substantially increase your nest egg by retirement compared to starting later. |
| Safe withdrawal rates are 3.5%–4% | This range sustains income across a 30-year retirement without depleting principal. |
| Annual reviews keep projections accurate | Update contributions, return assumptions, and Social Security estimates every year. |